About this project
The purpose of this project is to showcase my skills and knowledge in Microsoft Data Analysis & Data Visualization
Scenario
Process and clean the car sales dataset of 30 car manufacturers, visualize the difference between German and Japanese car makers
in their sales price, year resales value, and retention value percentage.
Then, visualize it within Excel software.
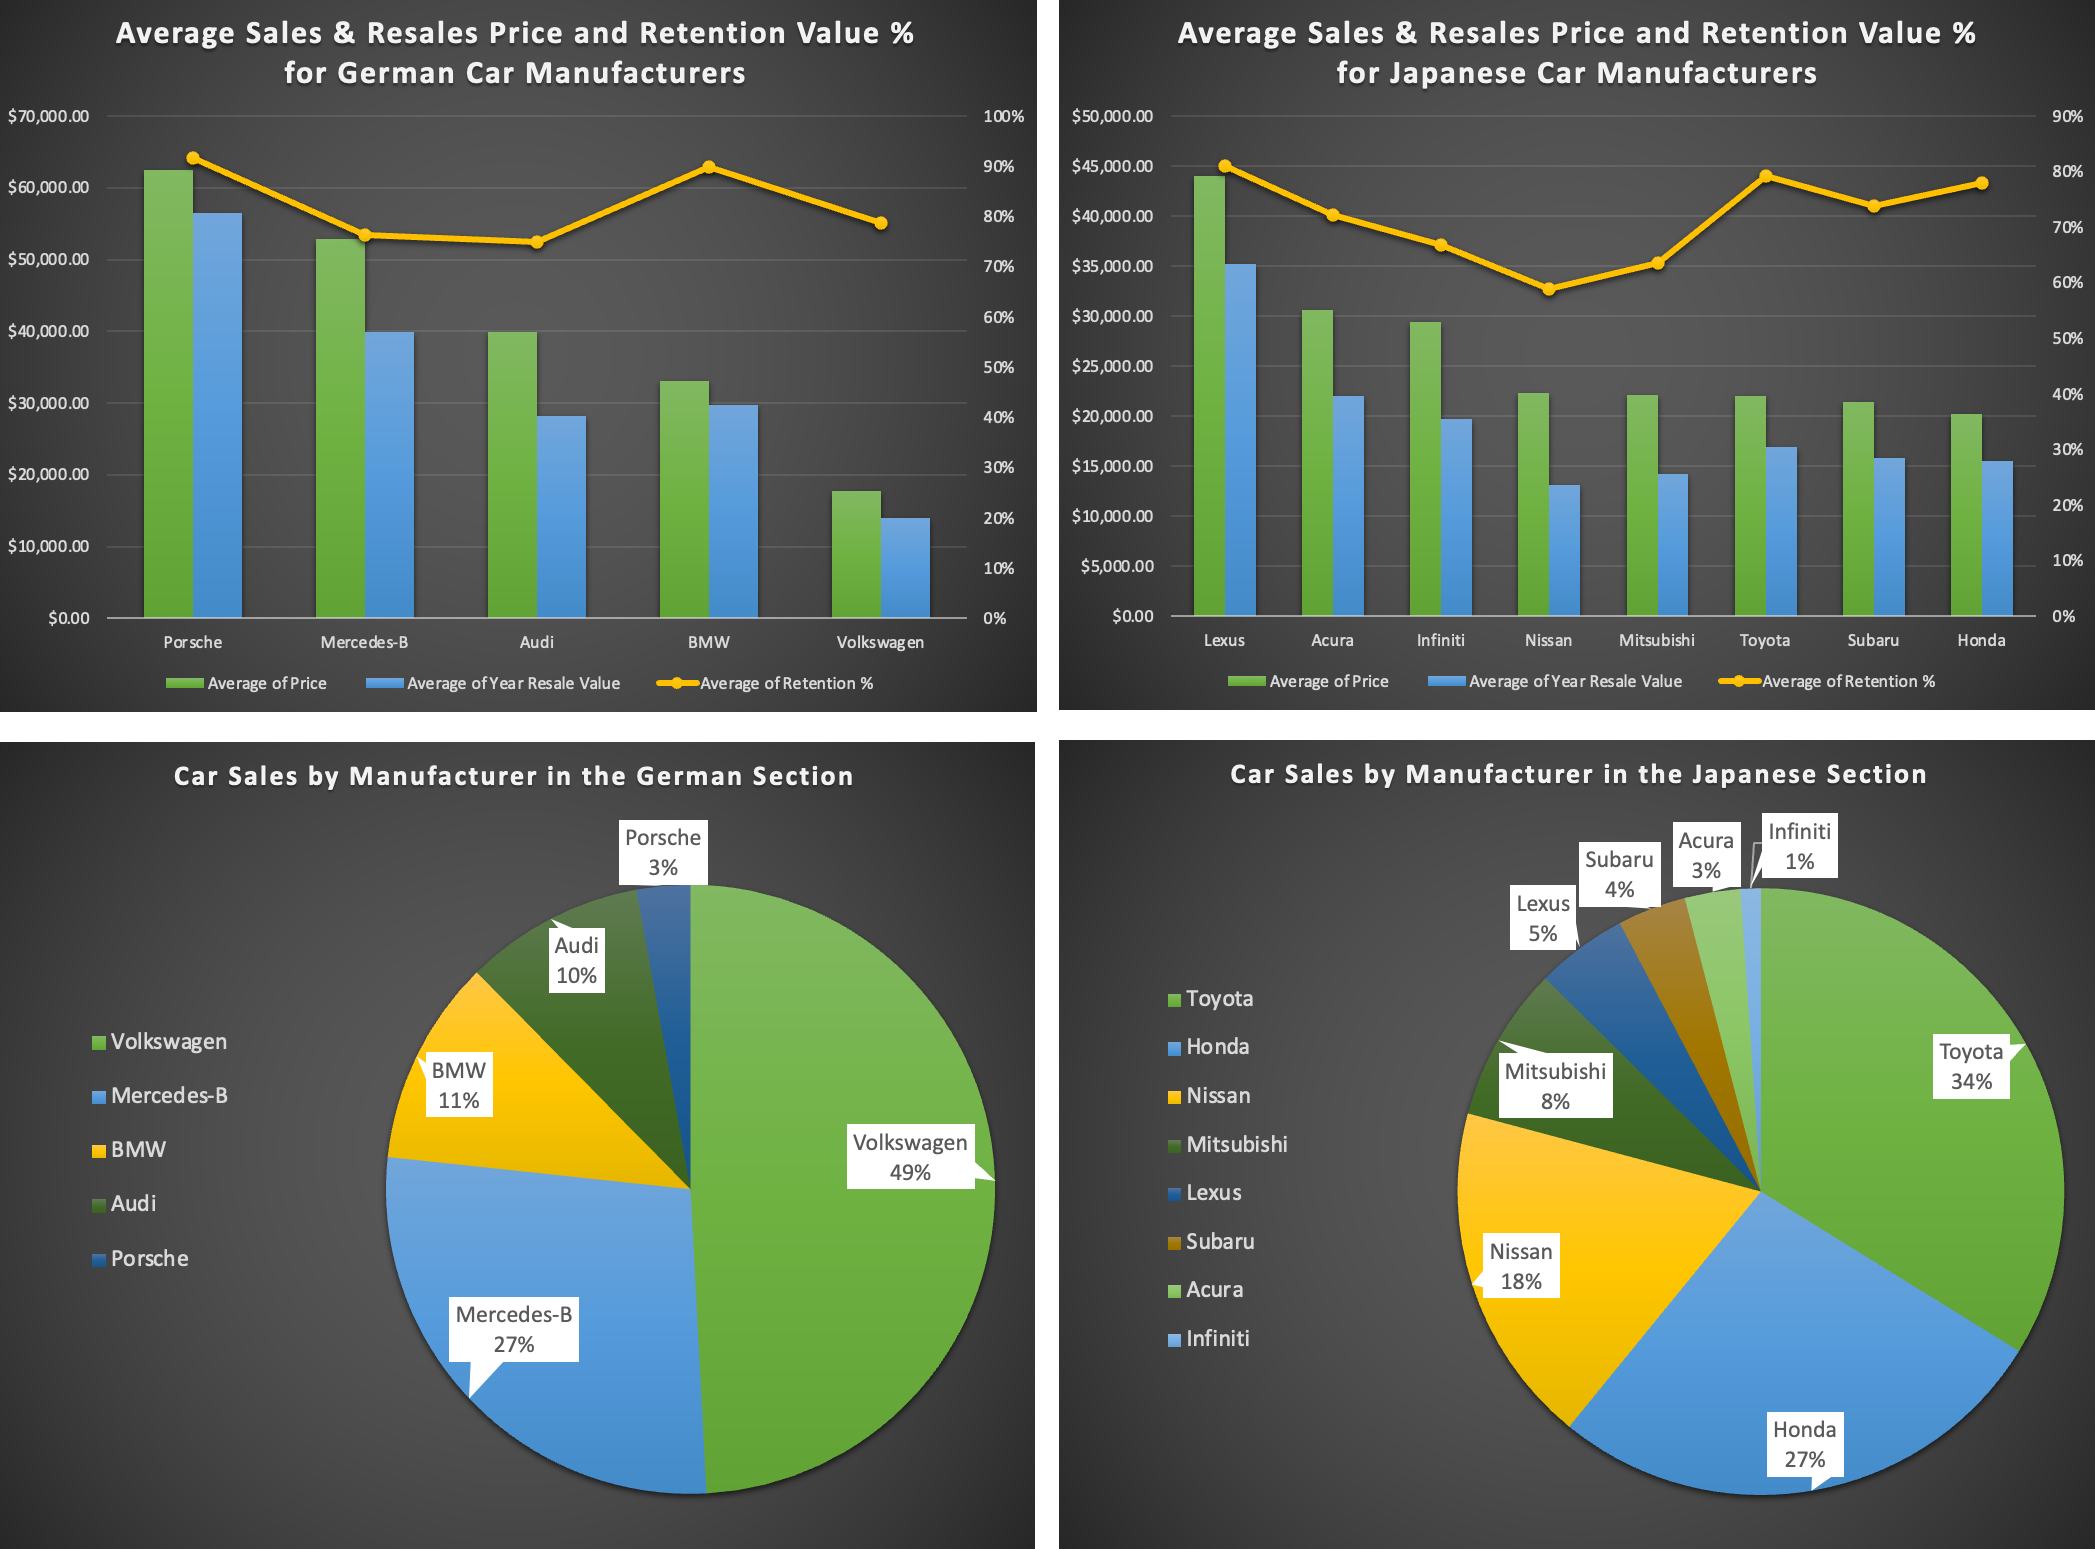
Excel Dashboard
Sales, Year Resales Price, and Retention Value % for Car Manufarturers
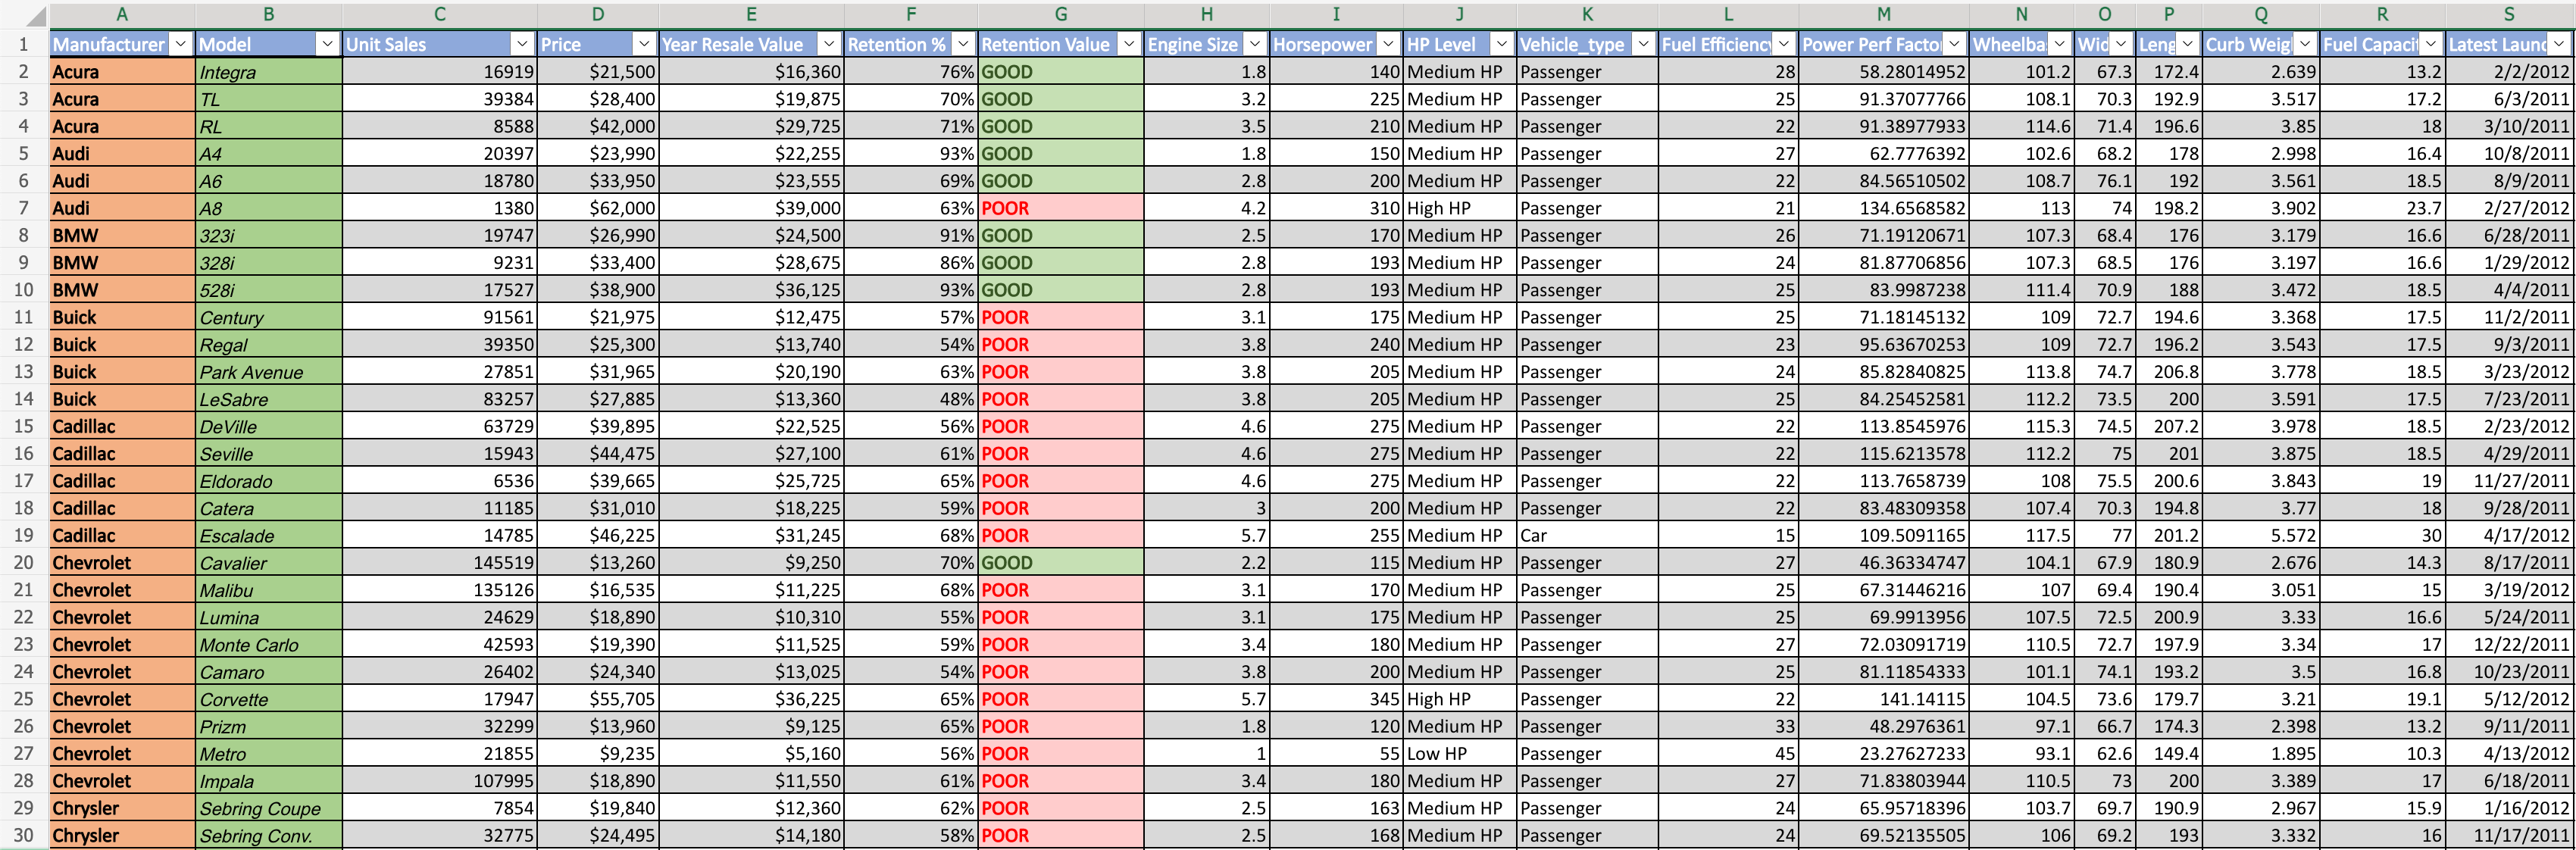
Snapshot of dataset
1 - 30 of 156 records
Pivot Tables
German Car Manufacturers
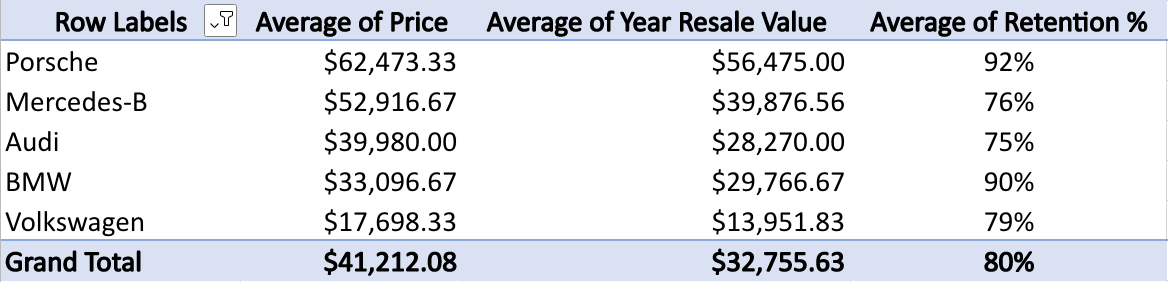
Figure 1 supports Visual A (top-left corner)
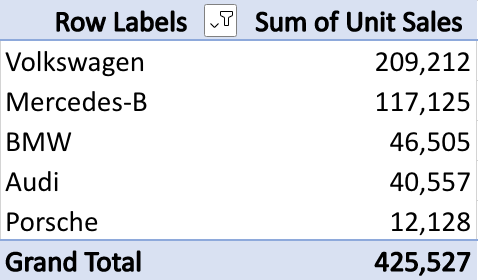
Figure 2 supports Visual B (top-right corner)
Japanese Car Manufacturers
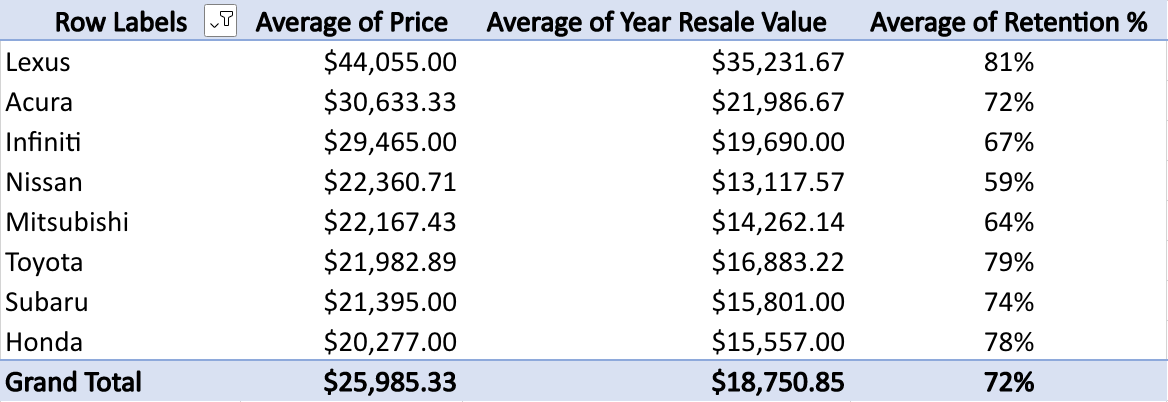
Figure 3 supports Visual C (bottom-left corner)
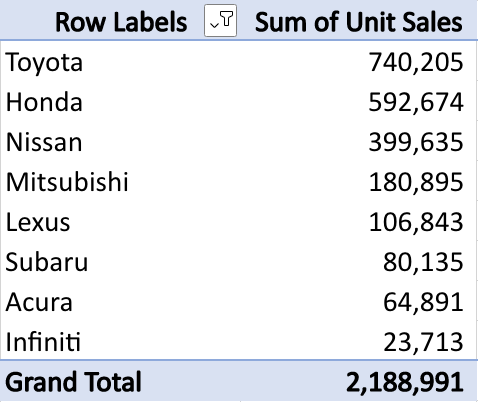
Figure 4 supports Visual D (bottom-right corner)