About this project
The purpose of this project is to showcase my skills and knowledge in Microsoft Power BI Data Visualization
About
In this project, you will learn the basics of using Microsoft Power BI, which is one of the most popular business intelligence tools out there, and you will learn how to use this software to import, transform, and visualize the dataset.
Scenario
You will clean and analyze the data from a credit card company. Then, visualize the trends and patterns of company' credit card defaults.
Tasks
- Importing the raw data.
- Identify errors and unreadable columns that might affect the accuracy of the reports in the data.
- Then, transform it to cleaned and analysis-ready dataset within Power BI software.
- Create different graphs based on variety of factors such as 'EDUCATION_LEVEL' and 'MARITAL_STATUS' that has an effect on credit card default issue.
- Group the graphs together to create a presentable dashboard for company's stakeholders.
- Generate slicers - important visual filter systems on the dashboard.
PowerBI Dashboard - Credit Card Defaults
To use the slicer, download 'defaults.pbix' file in "File Download" Section

Complete Power BI Work File Download
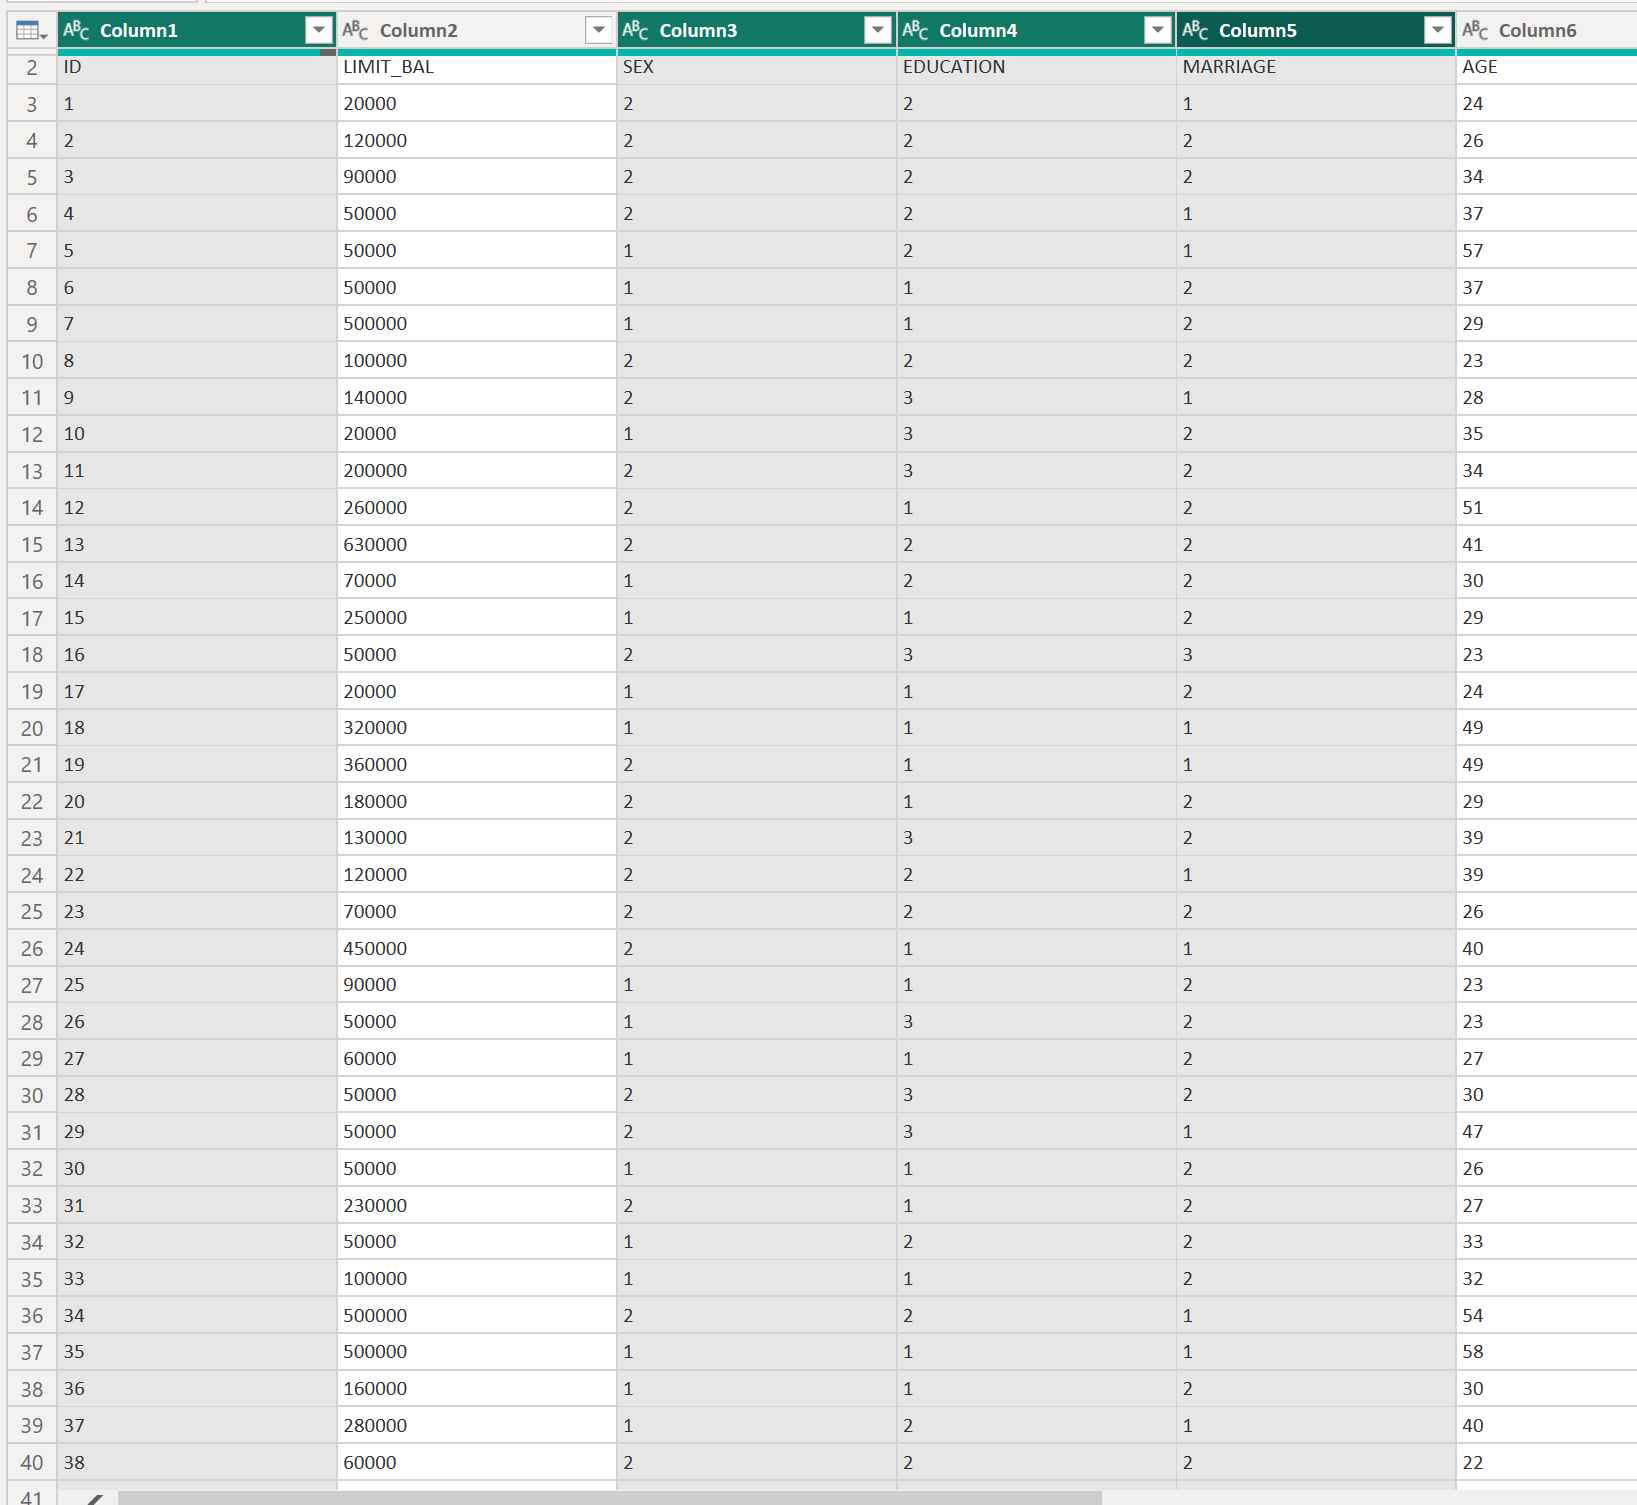
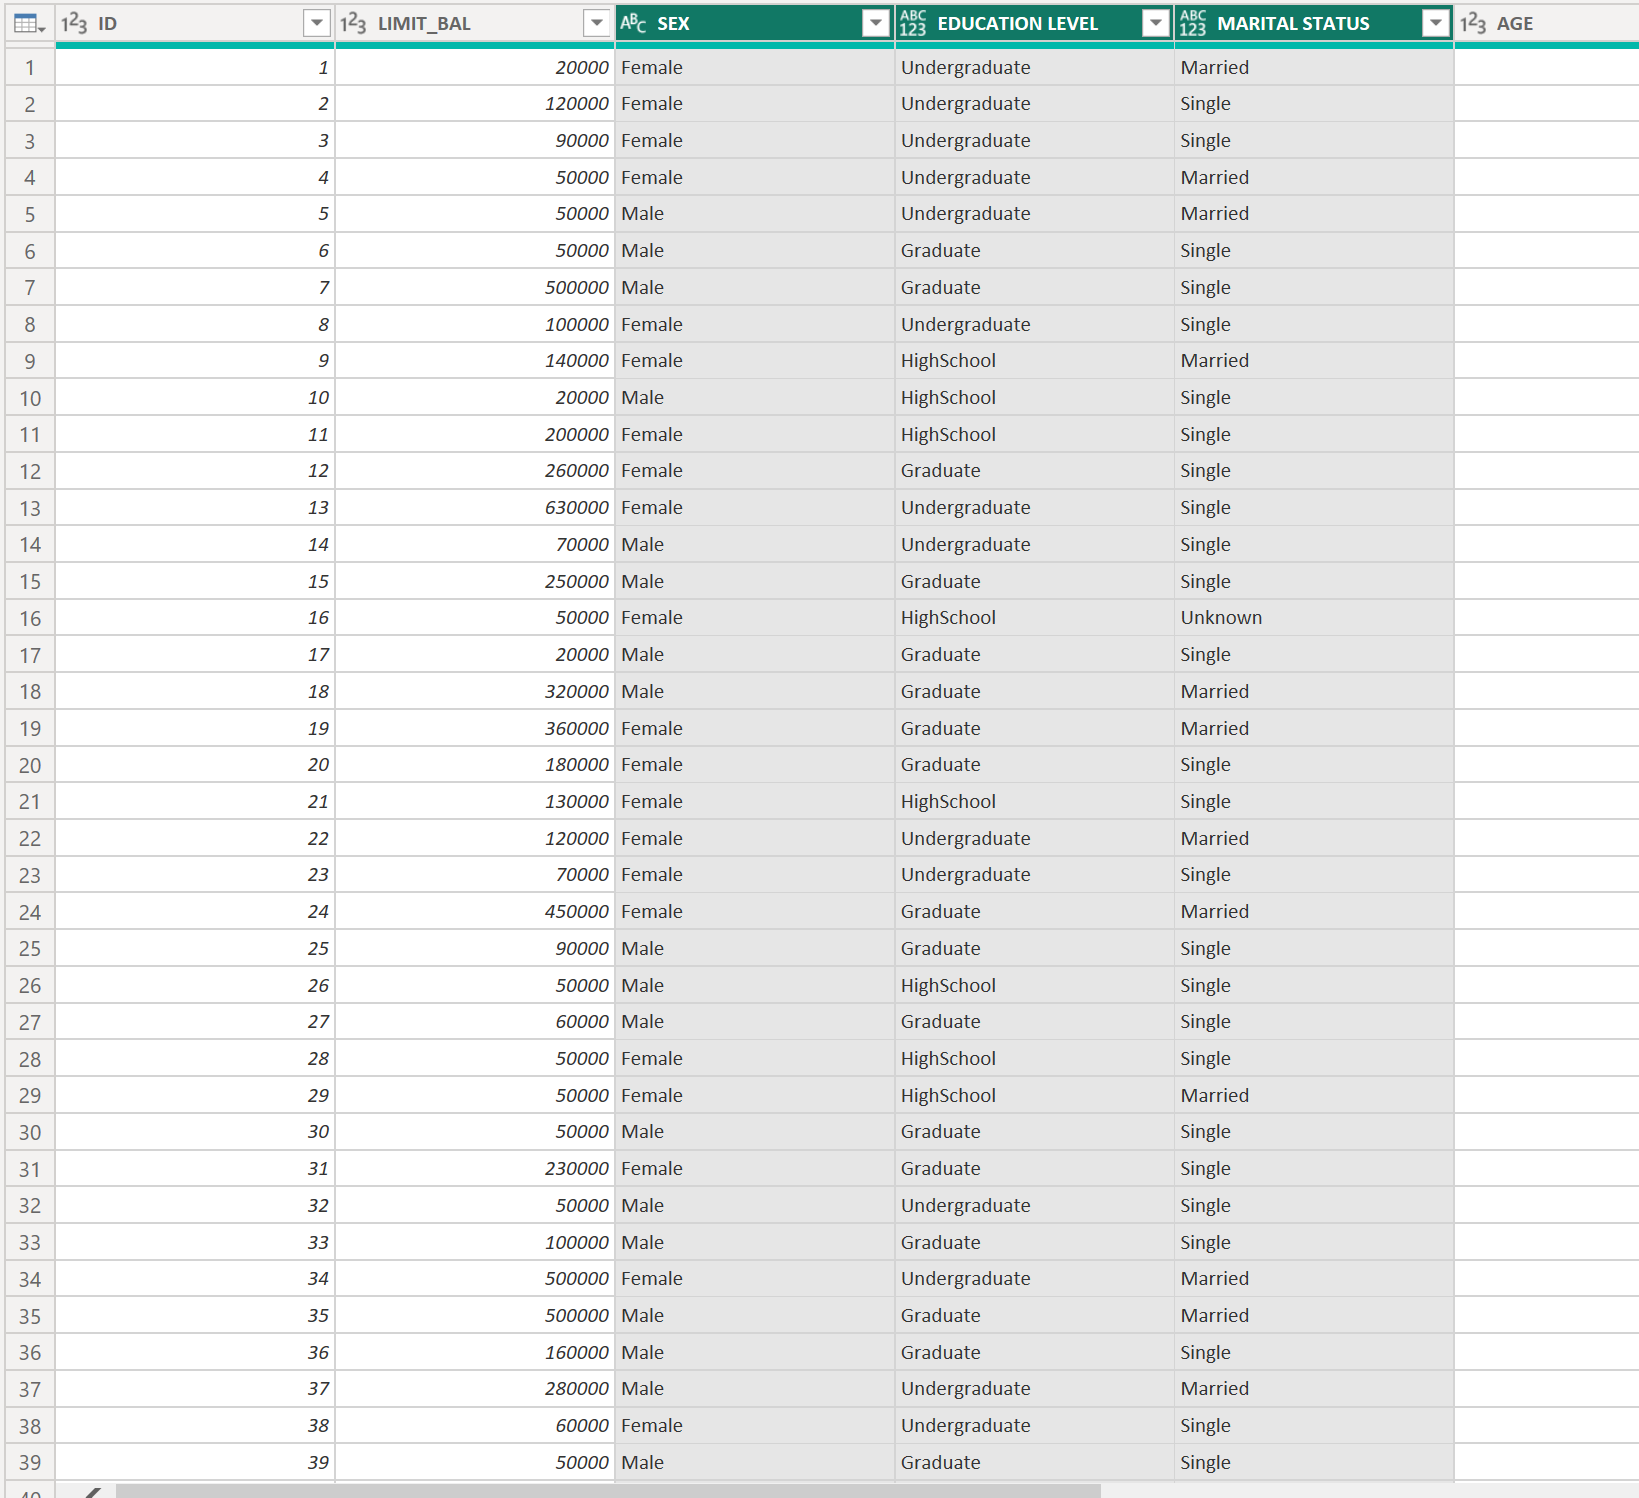
Data Transformation
- Delete incorrect header row, and assign the proper row to new header row.
- Transform thirty-thousand rows of unreadable data from columns such as SEX, EDUCATION LEVEL, and MARITAL STATUS.
- Column 'SEX': 1=MALE, 2=FEMALE, and Other=UNKNOWN
- Column 'EDUCATION_LEVEL: 1=GRADUATE, 2=UNDERGRADUATE, 3=HIGHSCHOOL, and Other=UNKNOWN
- Column 'MARITAL_STATUS': 1= Married, 2=SINGLE, and Other=UNKNOWN