
About this project
The purpose of this project is to showcase my skills and knowledge in Tableau Data Visualization and Excel spreadsheet.
Scenario
You oversee the North American logistics operations for a naton-wide retailer selling various imports products.
The congestion at ports, and skyrocketing fuel and transportation costs, has created the need for your company to rethink how your're currently importing and distributing your products throughout the US to continue to meet the demands of your customers.
You have been given the raw datasets and have been asked to clean, analyze the data and transform them into meaningful insights, trends, and patterns and present to company's executives.
- Tableau Dashboard -
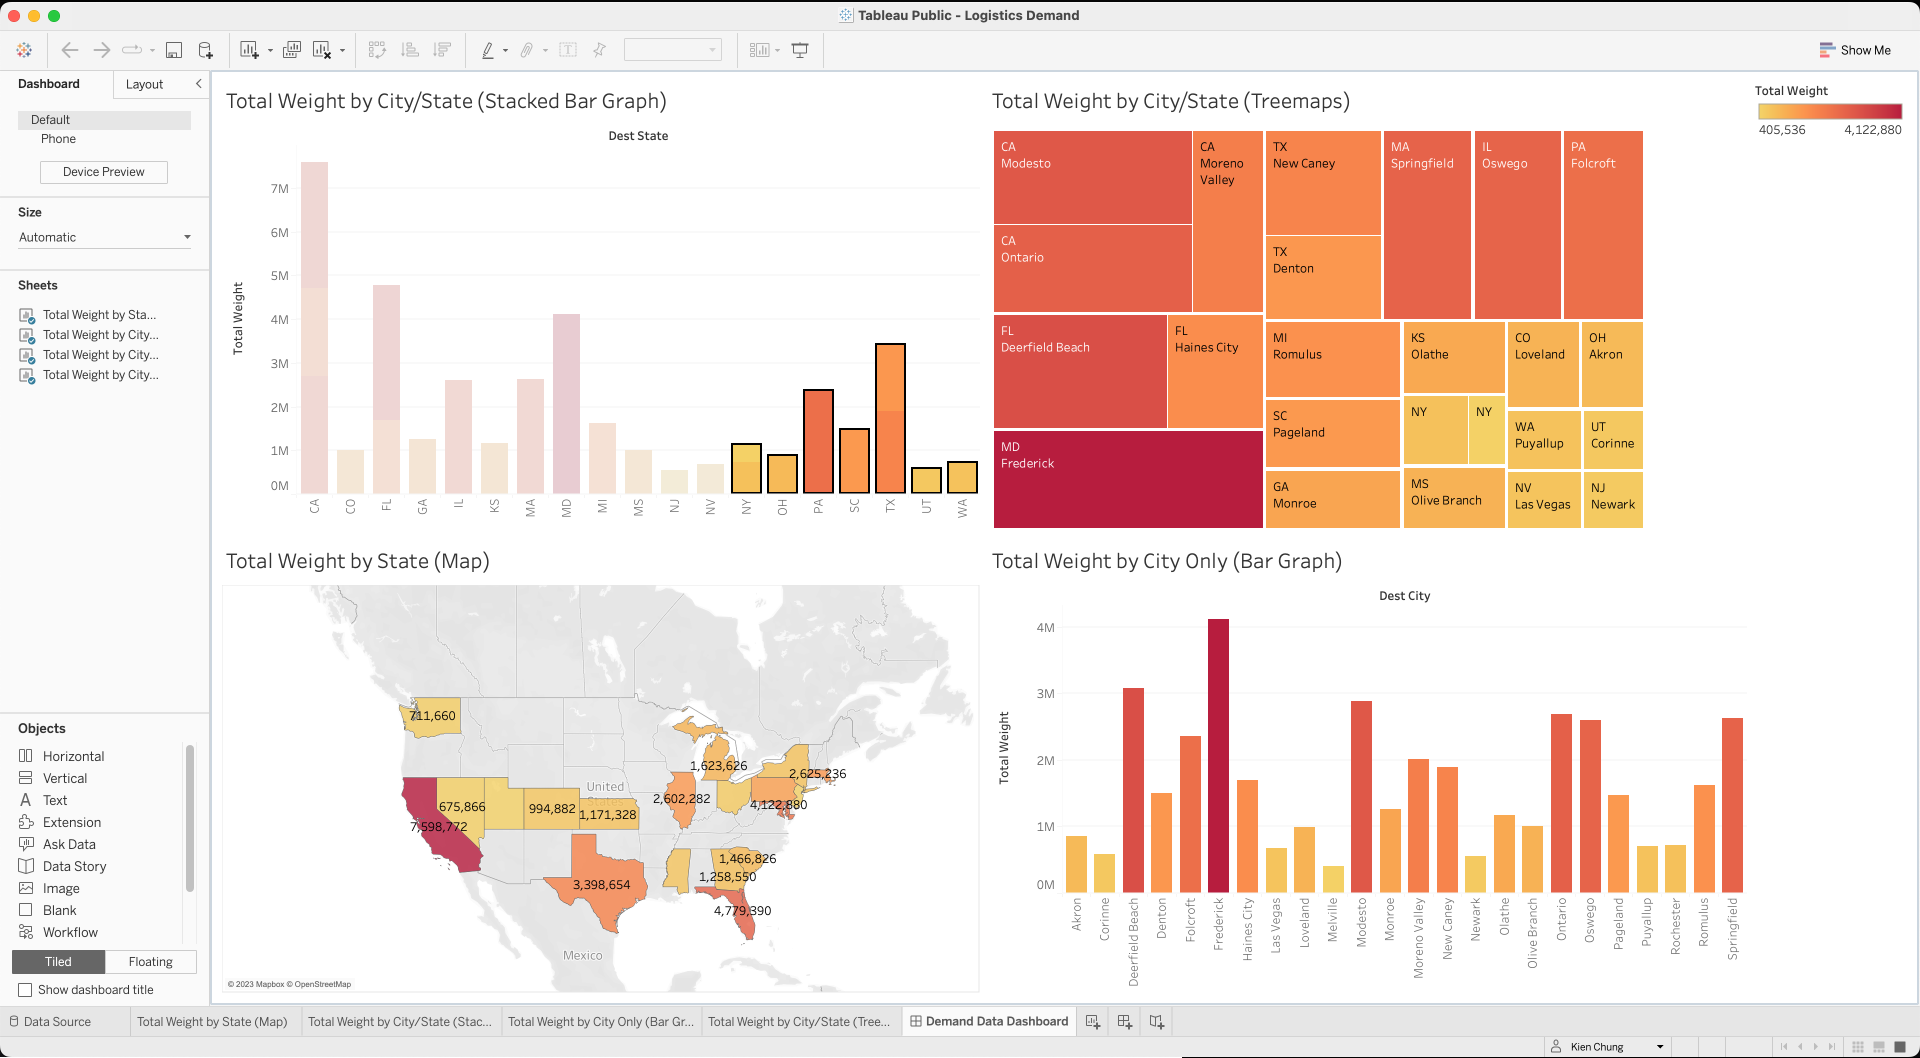
Logistics Demand by State/City
Container Shipping Rate
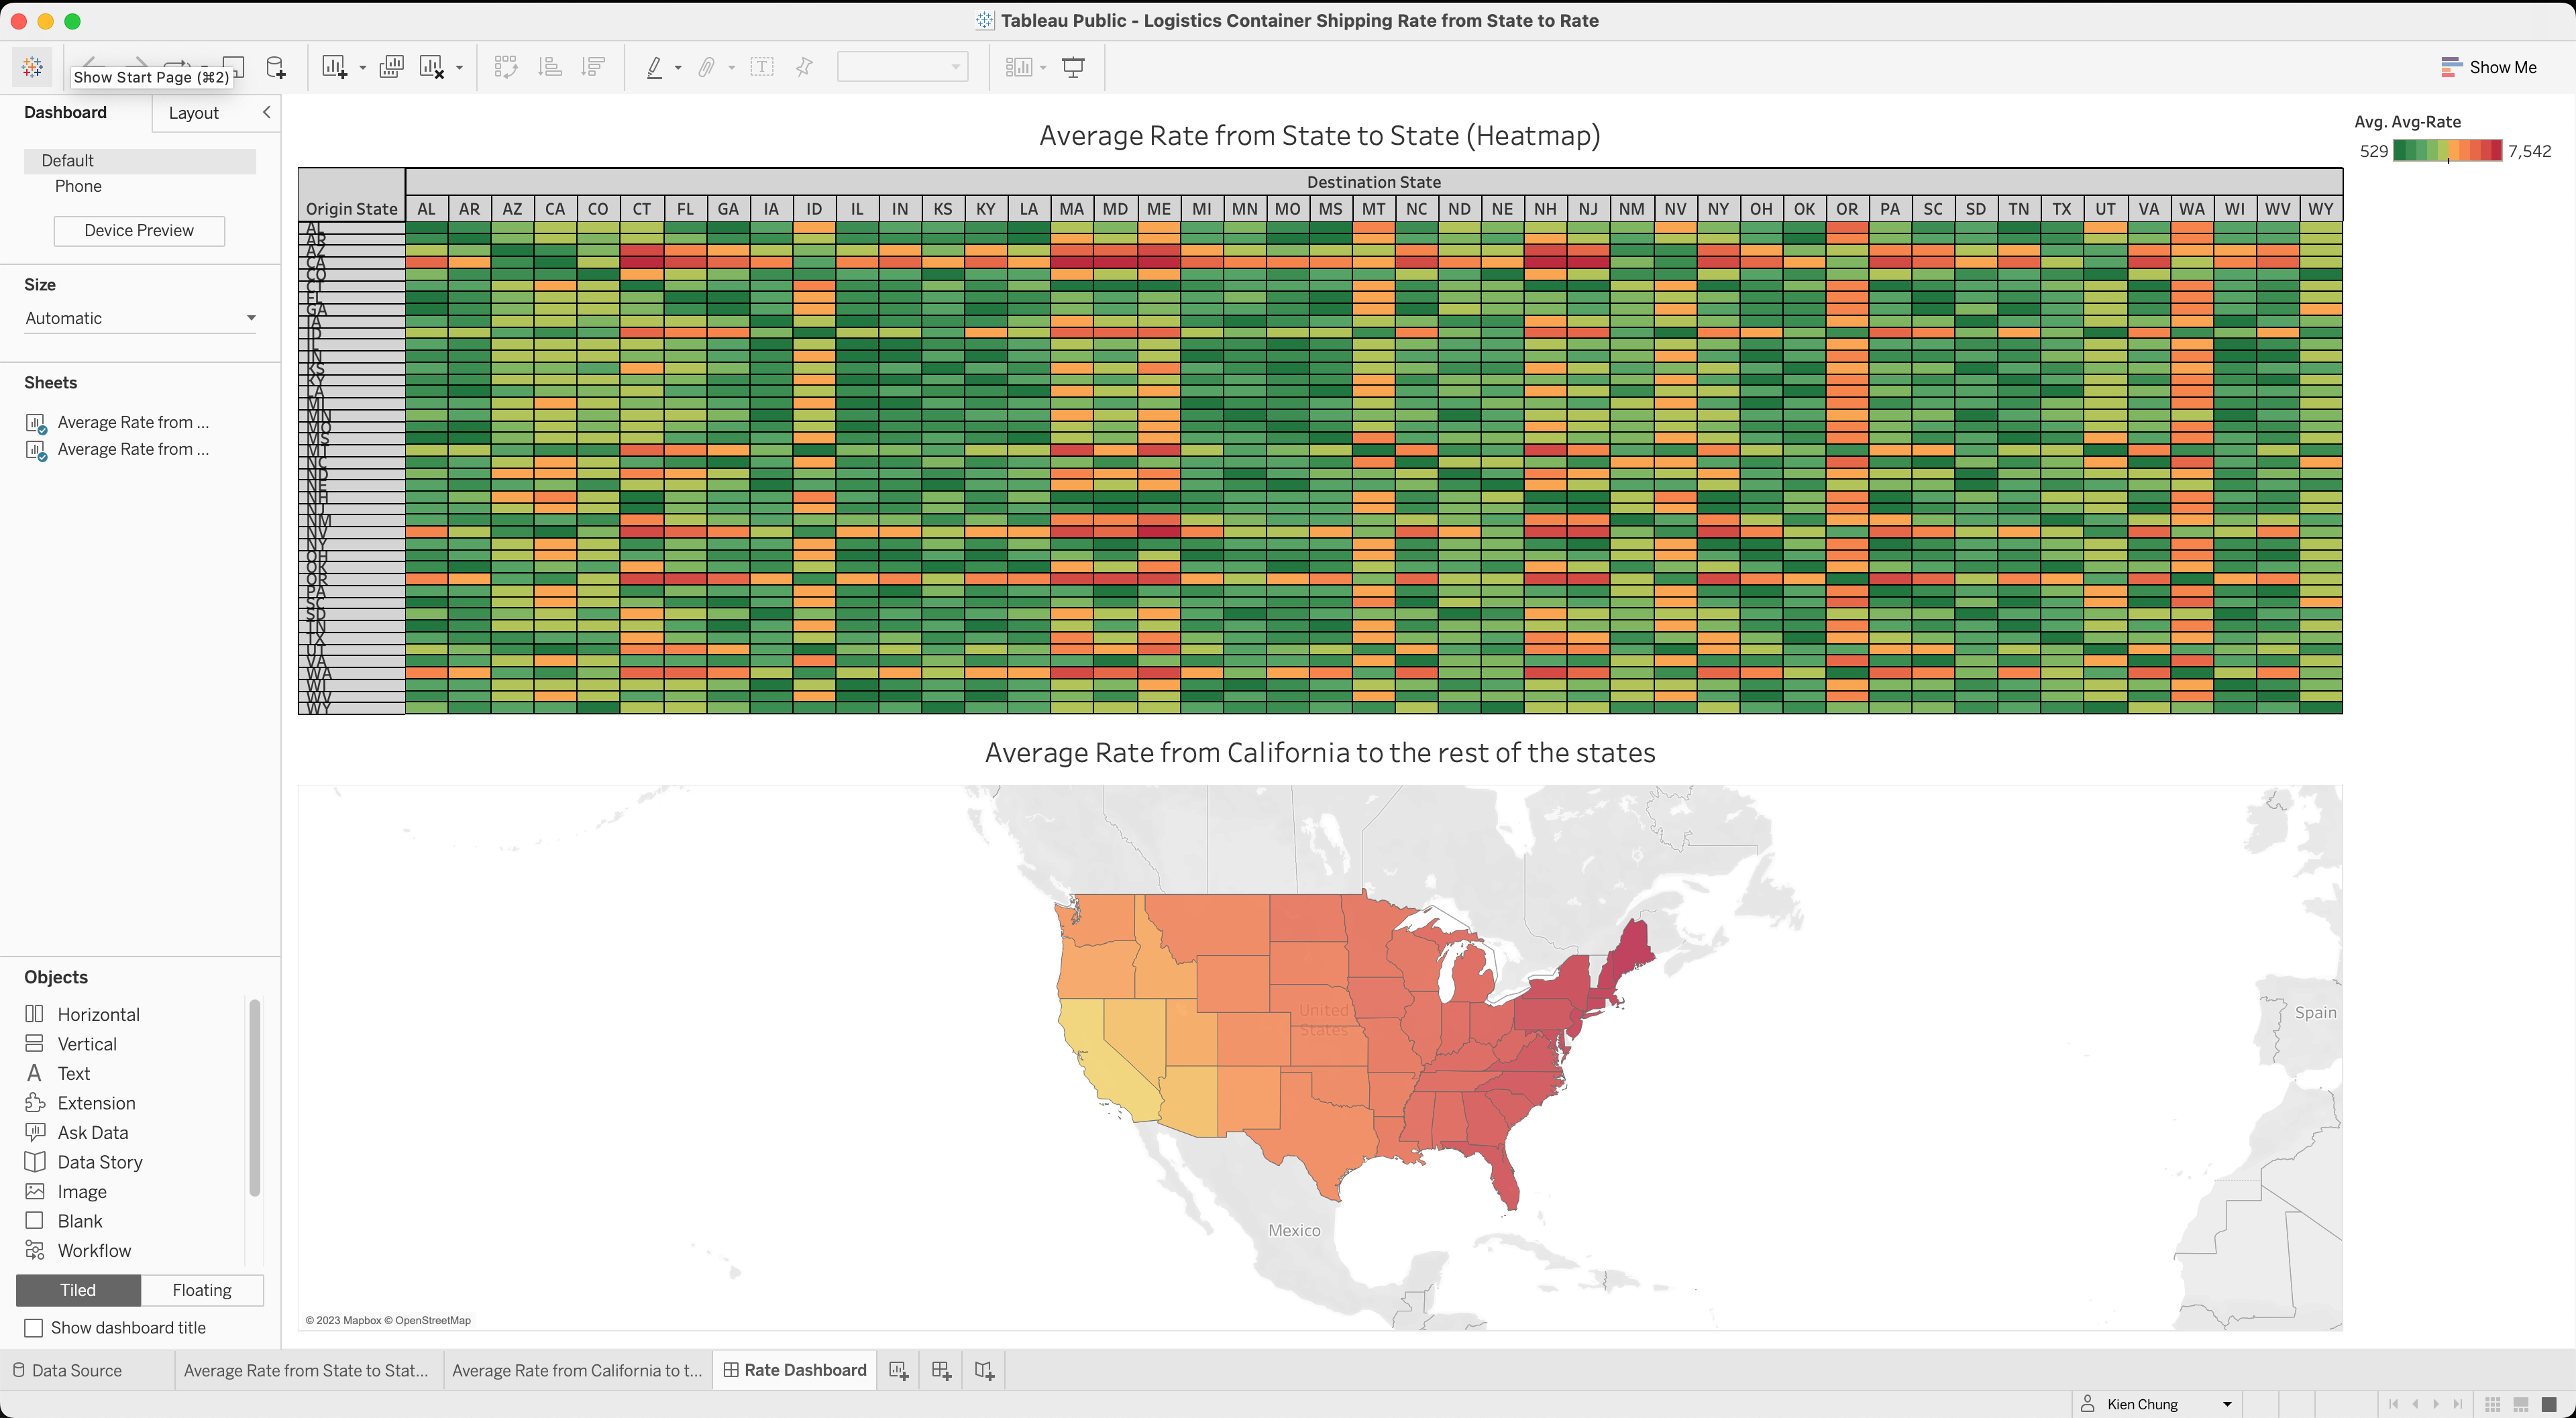
Tableau Public Profile & Dashboard Link
My Tableau Public Profile Link
https://public.tableau.com/app/profile/kien.chung
Logistics Demand Dashboard Link
https://public.tableau.com/app/profile/kien.chung/viz/LogisticsDemand/DemandDataDashboard
Logistics Container Shipping Rate Dashboard Link
https://public.tableau.com/app/profile/kien.chung/viz/LogisticsContainerShippingRatefromStatetoRate/RateDashboardWorksheets


Dataset Information & Download
Total of 1,263 records - DemandData.xlsx
[Download raw xlsx-file (86KB) here]
[Download cleaned xlsx-file (110KB) here]
Total of 623,809 records - RateData.xlsx
[Download raw xlsx-file (31.5MB) here]
[Download cleaned xlsx-file (38.8MB) here]