About this project
Cyclistic bike-share marketing analysis
Scenario
You are a junior data analyst working in the marketing analyst team at Cyclistic, a bike-share company in Chicago.
The director of marketing, Lily Moreno, believes the company’s future success depends on maximizing the number of annual memberships.
Therefore, your team wants to understand
From these insights, your team will design a new marketing strategy to convert casual riders into annual members.
But first, Cyclistic executives must approve your recommendations, so they must be backed up with compelling data insights and professional data visualizations.
Prerequisites
Cyclistic's finance analysts have concluded that riders with annual membership are much more profitable than casual riders.
Although the pricing flexibility helps Cyclistic attract more customers, the marketing director believes that maximizing the number of annual members will be key to future growth.
Goals
Design marketing strategies aimed at converting casual riders into annual riders.
In order to do that, however, the marketing analyst team needs to better understand how annual members and casual riders differ.
Moreno and her team are interested in analyzing the Cyclistic hitorical bike trip data to identify trends.
- Collect and prepare the previous 12 months of the company's trips data (December 2021 to November 2022).
- Combine, clean, and process dataset to get ready for analyzing.
- Analyze dataset, and visualize with ggplot() function.
- Share the conclusion of this analysis with the marketing director in order to answer the questions to support the company in making business decisions.
Objectives
Visualization
Click the graphs for full size image in new browser tab
Key Findings
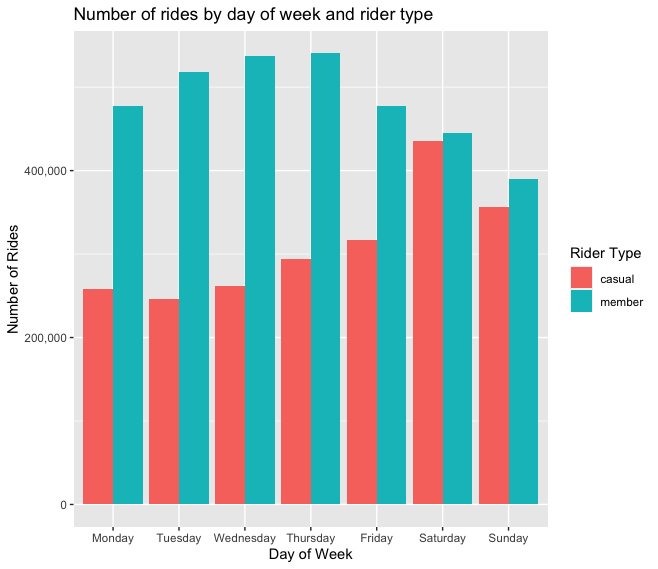
Membership riders complete about 75% more rides compared tocasual riders during the week.Membership riders ' average duration stays consistent throughout weekdays and has slight bump on the weekend.- So, one of the main reasons for
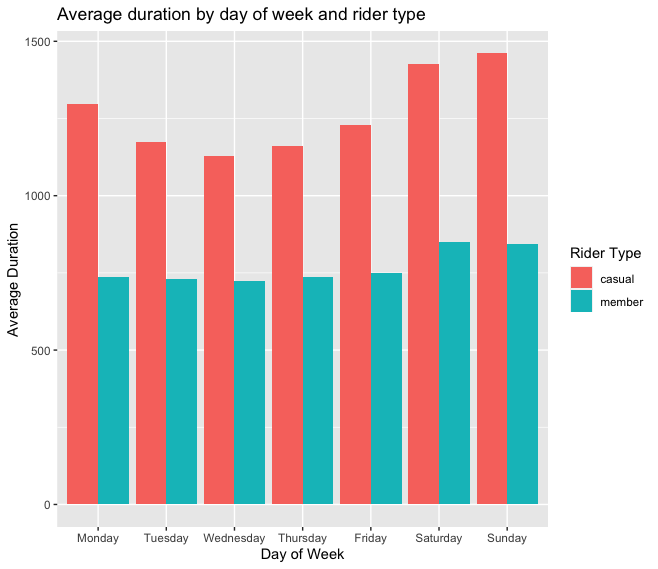
membership riders to sign up for annual membership is commuting to work. - The average duration of trips done by
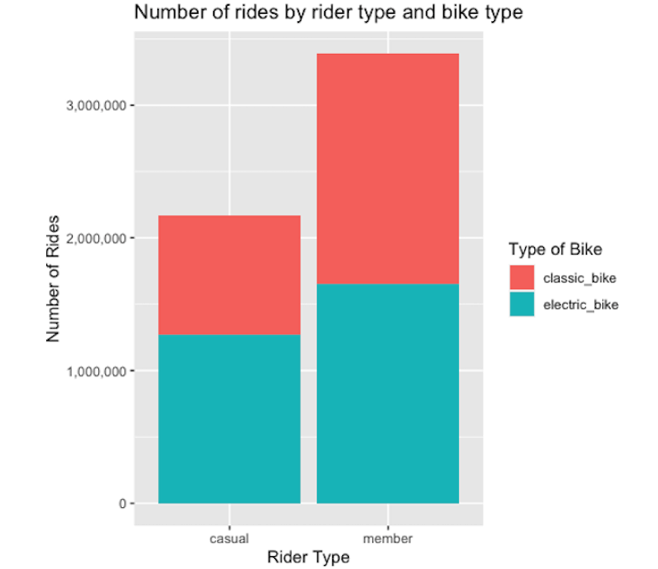
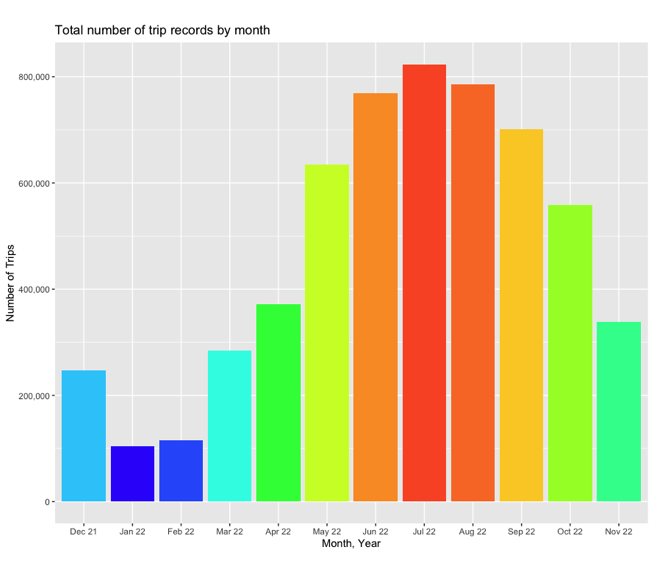
casual riders is significantly higher than trips done bymembership riders in any day of the week. Casual riders has shorter average duration during weekdays and longer average duration on the weekend.Casual riders also complete more rides on the weekend compared to weekdays.Casual riders are 35% more likely to ride an electric bike than a classic bike, and this ratio is about 50/50 formembership riders .- The number of rides in July is at least 8x more compared to the number of rides in January.
(In Chicago, July is the
Conclusion
The bike-sharing program tends to become busier during warmer weather, and the opposite occurs during colder weather.
Recommendations
In order to attract more casual riders and convert them to Cyclistic members, here are some recommendations:
- Because the majority of casual riders are tourists/visitors, we want to target only the small group of casual riders that are local to the city in order to maximize the profits. Therefore, we should introduce a membership tier at a lower price point compared to the more premium annual membership. This new membership tier is for the locals that don't need this bike-share program for commuting to work. But it still allows new customers to enjoy the program on the weekend at a more afforadable price point.
- Implement a limited-time promotion for customers who sign up for the membership for the first time. The promotion can either be "30 day free trial", or "half-price off 1st month", depending on the company's budget. The purpose of these promotions is to introduce the benefits, convienence, and potential savings to new members.
- Add more electric bikes into the existing fleet to meet the casual riders' demand.
My Analysis
Click RStudio icon to view the complete analysis report in new browser tab

Analyzed using R Programming language and RStudio software.
Analysis report was written in R Markdown (RMD),
and knitted to a Hypertext Markup Language (HTML) file.
Dataset Information & Download
Project Start Date: December, 2022
Previous 12 months of Cyclistic's trip data
December 2021 to November 2022
Total of 5,733,451 trip records within the past 12 months
Around 5.7 million rows of raw data
Raw datasets: 12 .CSV files in zipped folder (206MB zipped, 1.08GB unzipped)
[Download zipped file via Github LFS here]
After going through preparing, processing, and cleaning stage, there are 5,552,874 rows of complete and reliable data
Approximately 5.5 million trip records ready for analysis
Clean dataset in CSV file in zipped folder (193MB zipped, 1.03GB unzipped)
[Download clean dataset via Github LFS here]
| # | Month, Year | Number of trip record(s) |
|---|---|---|
| 1 | Decemeber, 2021 | 247,540 |
| 2 | January, 2022 | 103,770 |
| 3 | February, 2022 | 115,609 |
| 4 | March, 2022 | 284,042 |
| 5 | April, 2022 | 371,249 |
| 6 | May, 2022 | 634,858 |
| 7 | June, 2022 | 769,204 |
| 8 | July, 2022 | 823,488 |
| 9 | August, 2022 | 785,932 |
| 10 | September, 2022 | 701,339 |
| 11 | October, 2022 | 558,685 |
| 12 | November, 2022 | 337,735 |
| # | Total trips | 5,733,451 |