About this project
The purpose of this project is to showcase my skills and knowledge in Microsoft Excel
Scenario
In this project, you will be following the scenario of a recently hired Junior Data Analyst in a local government office,
who has been tasked with importing some data from another department which relates to inventory information about their fleet of vehicles,
sorting and analyzing fleet inventory data that was previously imported and cleaned.
The data is in comma-separated value (CSV) format and the data also needs cleaning up before you can start to run any kind of analysis on it.
You plan to use pivot tables to analyze the data in preparation for the results to be visualized in a dashboard and added to a data findings report later.
Data used in this project
The dataset used in this lab comes from the following source under a Public Domain license:
[https://data.montgomerycountymd.gov/Government/Fleet-Equipment-Inventory/93vc-wpdr]
We are using a modified subset of that dataset for the lab, so to follow the lab instructions successfully please use the dataset provided with the lab, rather than the dataset from the original source.
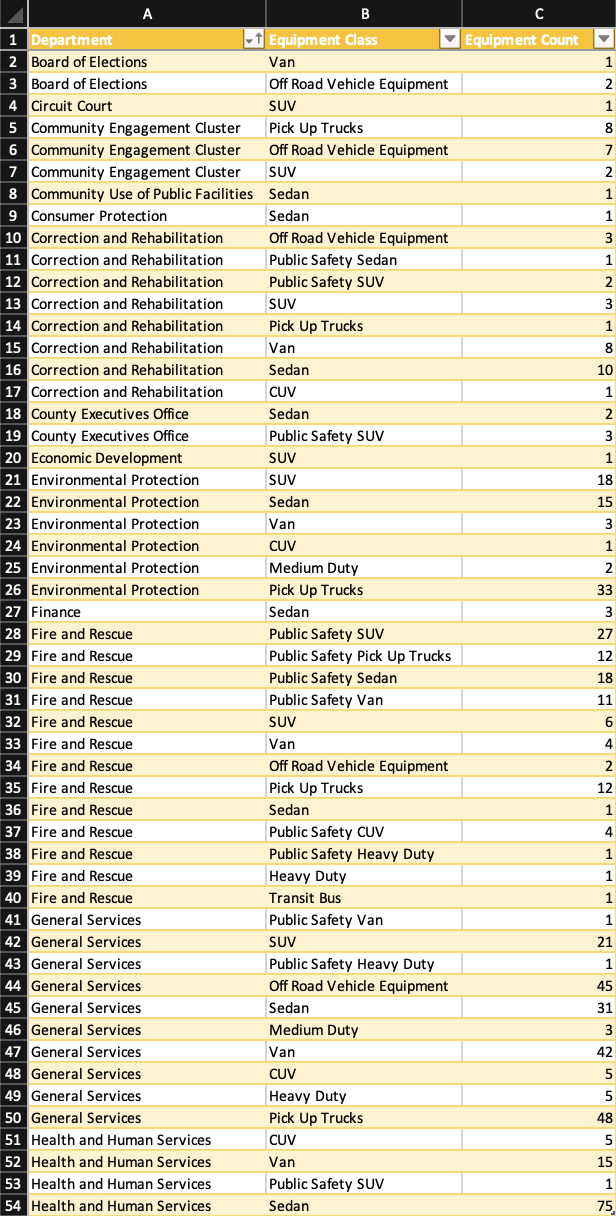
Snapshots of data
Figure I: Import raw data
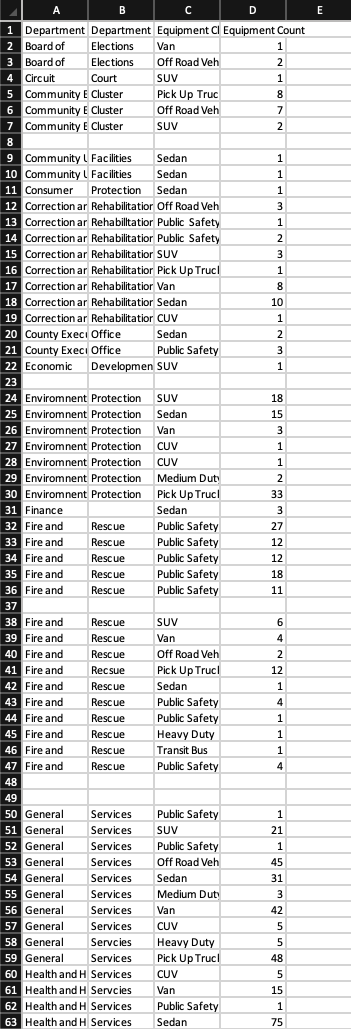
Figure II: Cleaned and analysis-ready data
Pivot Tables
Table I & II
Department (category) and Equiptment Count (values)
Equiptment Class (category) and Equiptment Count (values)
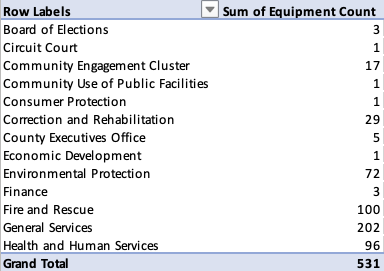
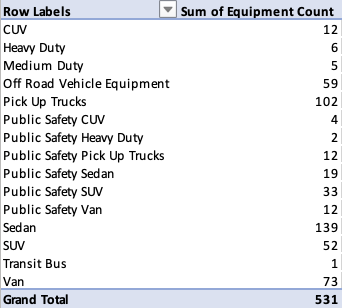
Table III
Department (category) with Equipment Class (sub-category) and Equipment Count (values)
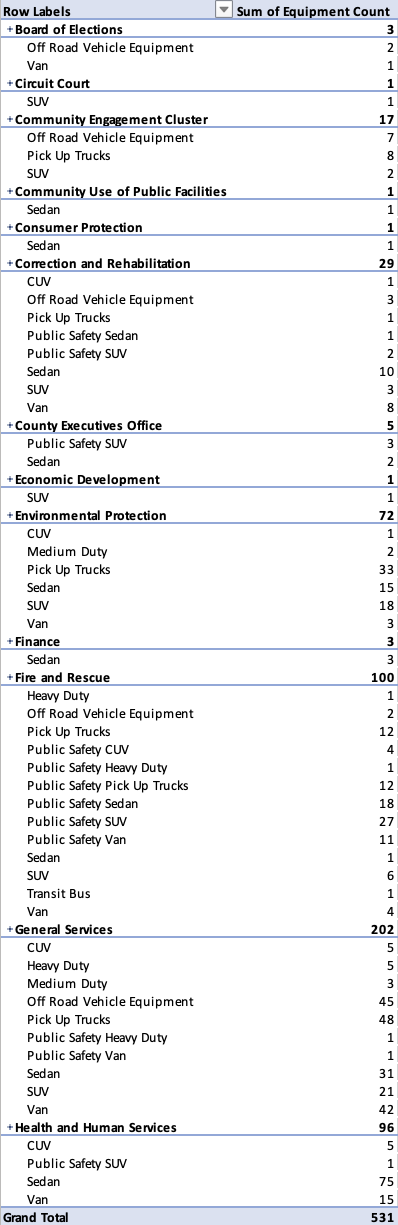
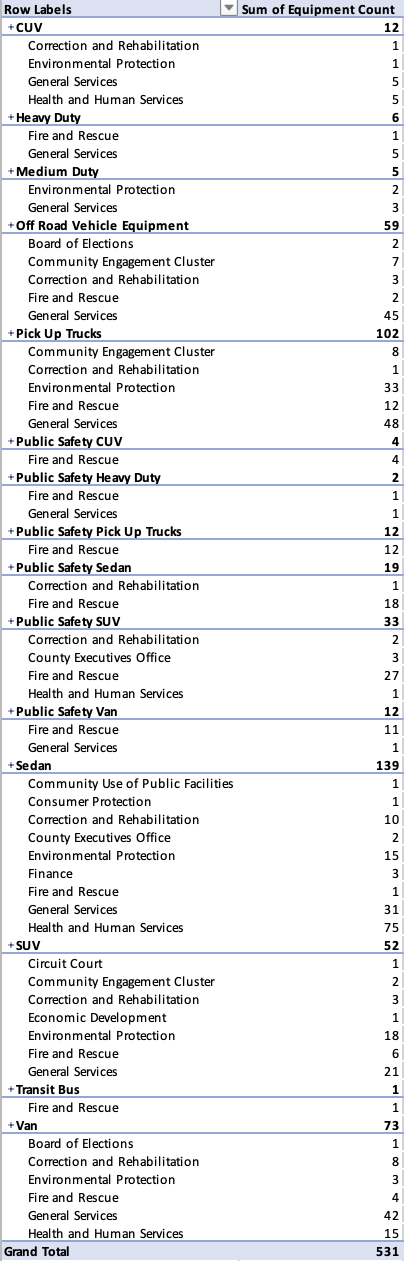
Table IV
Equipment Class (category) with Department (sub-category) and Equipment Count (values)
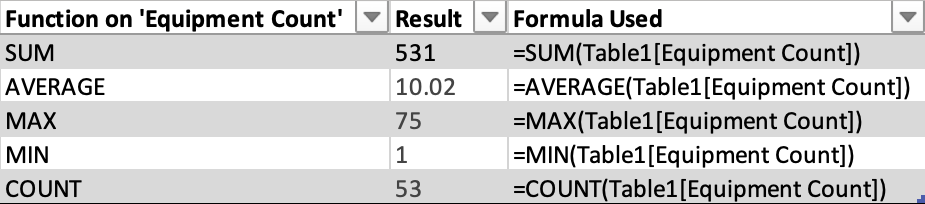
Calculated Values
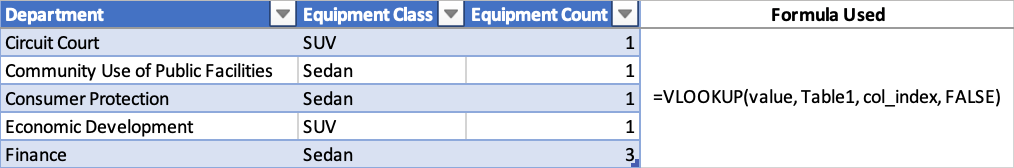
Excel LOOKUP
My Analysis
There are 13 departments in this local government office,
"general services" department has the largest amount of 202 vehicles.
That is about 38% of the entire fleet of 531 vehicles.
Among those 202 vehicles, 78% consists off-roads, pick-up trucks, vans, and SUVs.
Eventhough larger vehicles are preferred in many departments,
the office owns the most vehicles in sedan category, the number is 139 sedans, which is 26% of the entire fleet.